Back
17 Feb 2020
NZD/USD Asia Price Forecast: Kiwi trades off 2020 lows, above 0.6400 figure
- NZD/USD entered a range after bouncing from 2020 lows.
- The level to beat for bulls is the 0.6443 resistance.
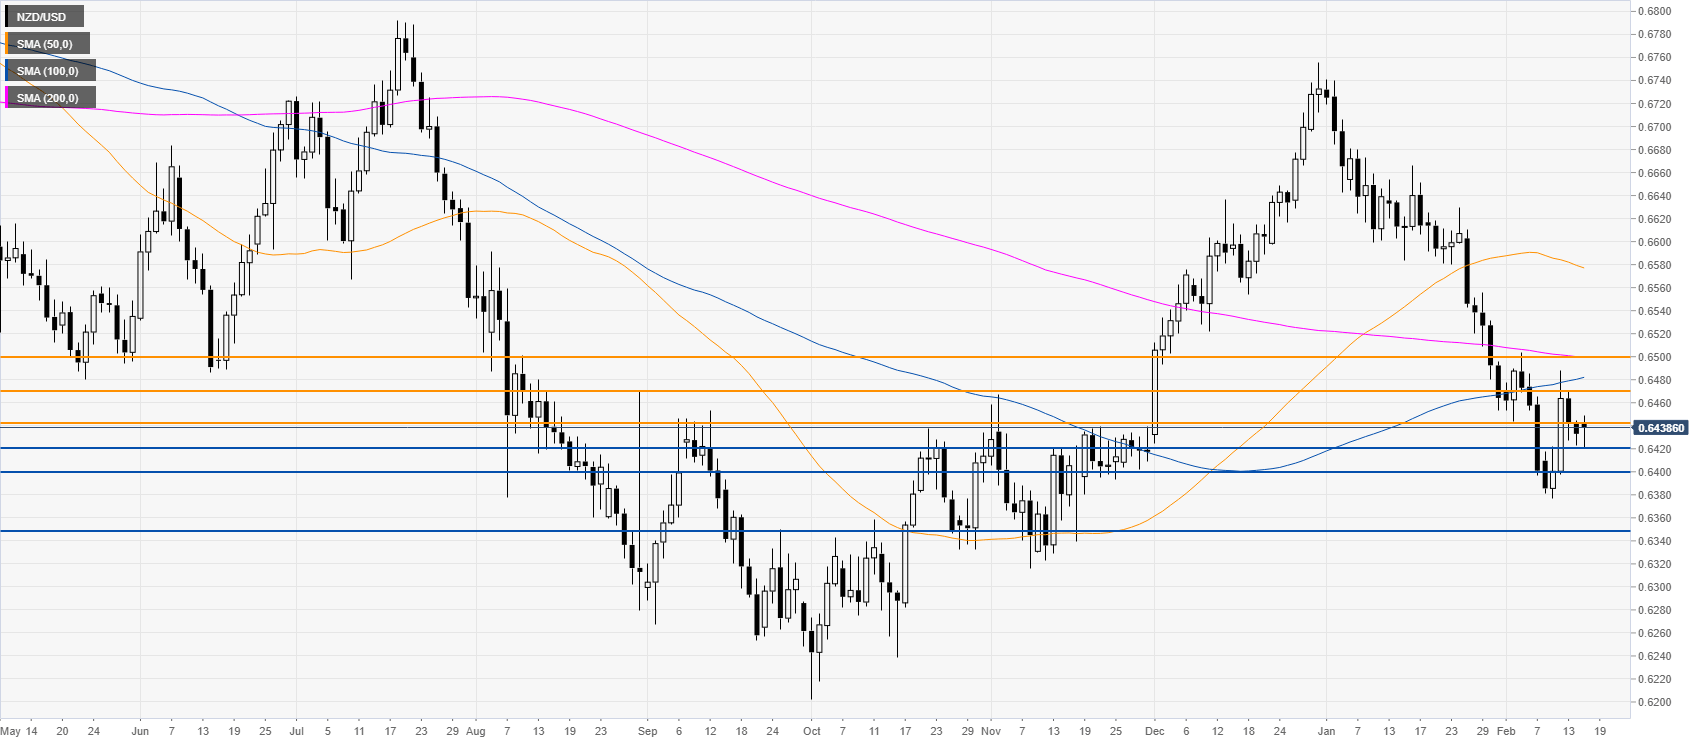
NZD/USD daily chart
After bouncing from fresh 2020 lows, NZD/USD has entered a range above the 0.6400 figure and below the main daily simple moving averages (SMAs), suggesting a bearish bias. Sellers want to resume the bear trend and break below the 0.6423 level to drive the market south towards 0.6400 and 0.6370, according to the Technical Confluences Indicator. However, bulls are trying to create a reversal up and break above 0.6443, 0.6470 and 0.6500 figure.
Resistance: 0.6443, 0.6470, 0.6500
Support: 0.6423, 0.6400, 0.6370
Additional key levels